Supply & Demand
Every year, +800MMT of agricultural commodities are transported by sea, of which AgFlow tracks +755MMT –that’s a +94% coverage in +800 ports globally. With around 200,000 voyages tracked to this day and +2,000 new vessels tracked monthly, including up to 1,500 updates per day, AgFlow has unparalleled coverage of worldwide agricultural commodities trade flows.

Supply & Demand Package
Select a feature below to see more details:
Supply & Demand
Every year, +800MMT of agricultural commodities are transported by sea, of which AgFlow tracks +755MMT –that’s a +90% coverage in +800 ports globally. With +200,000 voyages tracked to this day and +2,000 new vessels tracked monthly, including up to 2,000 updates per day, AgFlow has unparalleled coverage of worldwide agricultural commodities trade flows.
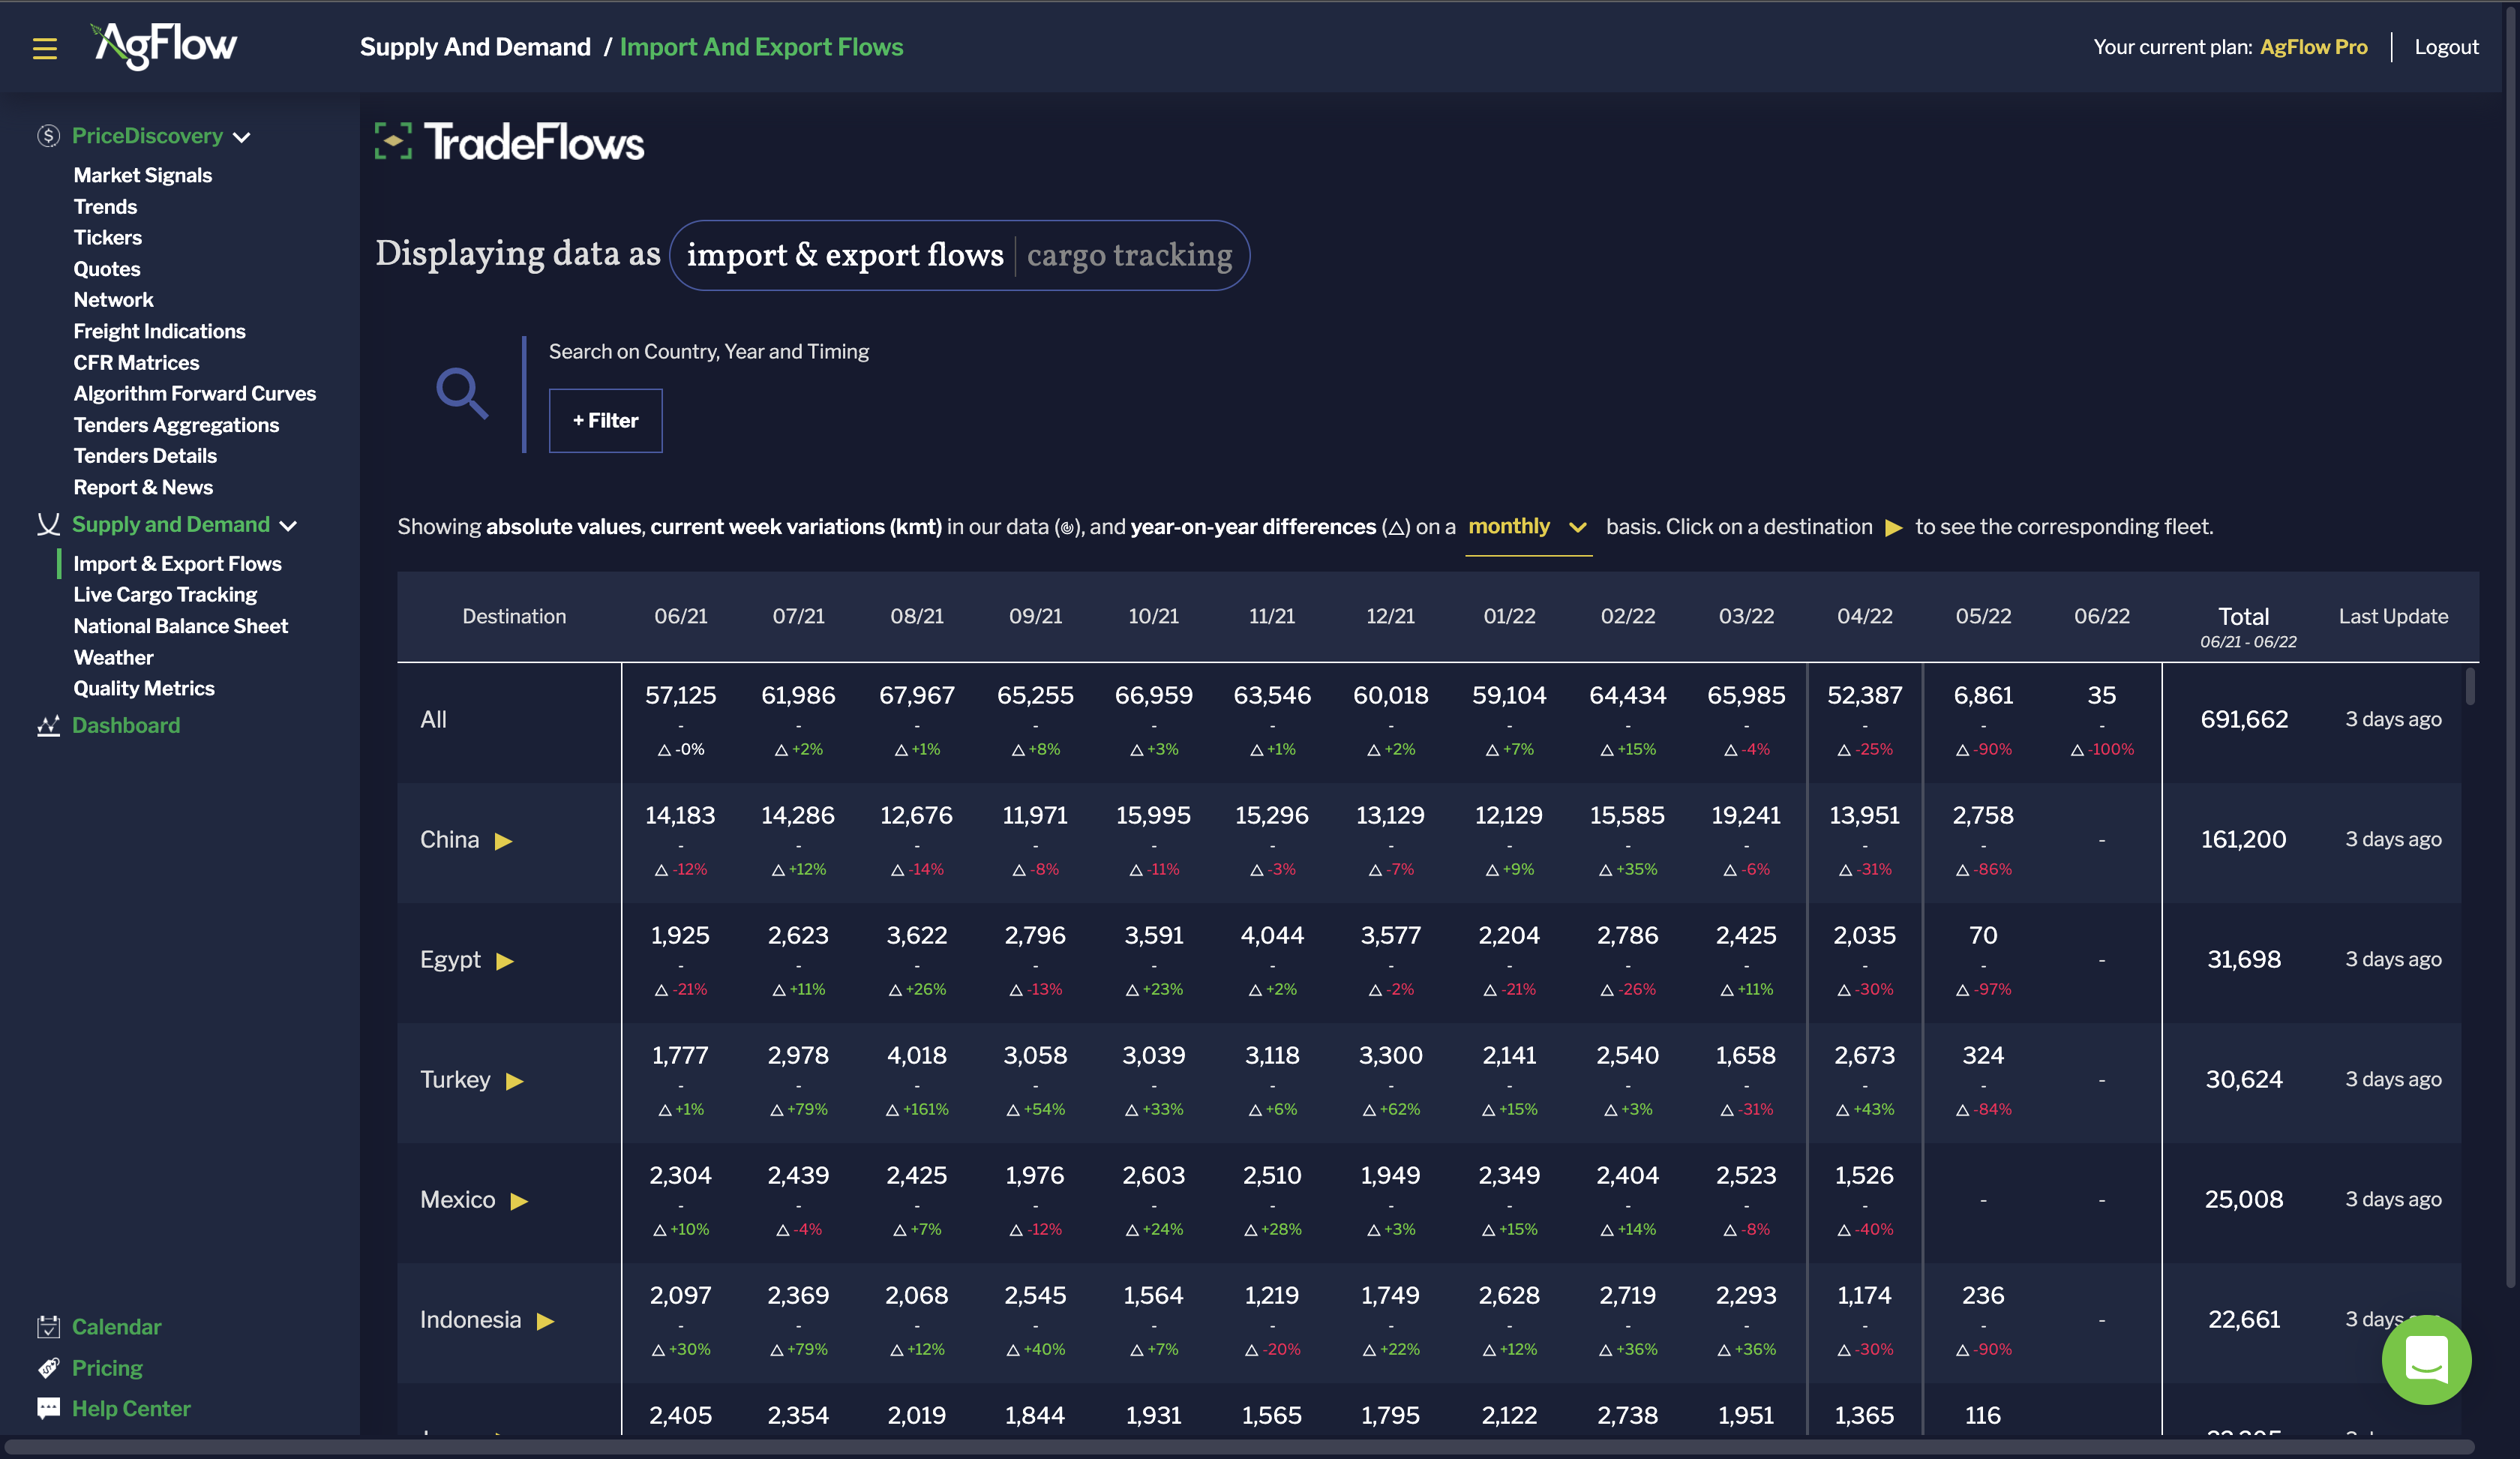
Import & Export Flows
Follow the global demand variations over the last years and view the demand for the next two months thanks to most accurate and timely trade flows data available on the market to:


Market Research
Build supply & demand analysis through historical trade flow trends to forecast price moves.
Risk Management
Ensure compliance with regulations and contract terms.
Sourcing
Identify sourcing opportunities and assess competitive advantage in the market.
Trading
Keep track of global supply & demand and follow competitors’ exposures.


Anticipate Global Ag Demand
- Tracking 755 Mmt of Grains, Oilseeds, and Vegoils demand yearly, at loading point of time
- +2,000 Vessels tracked
- +800 Ports covered
- Exclusive data from SGS, Alphamar, NABSA, and more
- Access granular metadata such as cargo, tonnage, export & import country, vessels names, and more
- Access historical trade flows data since 2013
Import & Export Flows
Follow the global demand variations over the last years and view the demand for the next two months thanks to most accurate and timely trade flows data available on the market.
Anticipate Global Ag Demand
- Tracking 755 Mmt of Grains, Oilseeds, and Vegoils demand yearly, at loading point of time
- +2,000 Vessels tracked
- +800 Ports covered
- Exclusive data from SGS, Alphamar, NABSA, and more
- Access granular metadata such as cargo, tonnage, export & import country, vessels names, and more
- Access historical trade flows data since 2013

Live Cargo Tracking
Get access to the only tool that allows you to view in-real time which cargo is on which vessels that neither traditional tracking tools nor customs can rival with, to:


Market Research
Follow destination swaps and correct supply & demand analysis.
Risk Management
Follow execution and mitigate execution risks.
Sourcing
Monitor if the annual supply will be delivered as per plan.
Trading
Follow execution and global trade flows.

Track Global Ag Demand in Real-Time
- Unrivaled timeliness: track cargoes as soon as vessels are loading
- Actionable information: filter by commodity or destination to follow cargo volumes, ETAs & destination ports
- Exclusive data: no other tool allows you to track cargoes live
- Access granular meta data such as vessel names, cargo volumes, and import ports
Live Cargo Tracking
Get access to the only tool that allows you to view in real time which cargo is on which vessels that neither traditional tracking tools nor customs can rival with.
Track Global Ag Demand in Real-Time
- Unrivaled timeliness: track cargoes as soon as vessels are loading
- Actionable information: filter by commodity or destination to follow cargo volumes, ETAs & destination ports
- Exclusive data: no other tool allows you to track cargoes live
- Access granular meta data such as vessel names, cargo volumes, and import ports
National S&D Balance Sheets
Access simultaneously 9 national balance sheets and use the dynamic charts to view how production and consumption variables have evolved since 2013.


Track Global Production & Consumption
- 9 sources: Comex Stat, IGC, Gafta, Canada grains council, Conab, USDA, European commission, ABARES, Ministerio de Agricultura, Ganaderia y Pesca
- Up to 15 different variables per search including Exports, Imports, Production, Total Supply, or Total Distribution
National S&D
Balance Sheets
Access simultaneously 9 national balance sheets and use the dynamic charts to view how production and consumption variables have evolved since 2013.
Track Global Production & Consumption
- 9 sources: Comex Stat, IGC, Gafta, Canada grains council, Conab, USDA, European commission, ABARES, Ministerio de Agricultura, Ganaderia y Pesca
- Up to 15 different variables per search including Exports, Imports, Production, Total Supply, or Total Distribution

Weather Impact on Crops
Compare the last 8 years of satellite data from NOASS and COPERNICUS with today’s forecast to see how the weather impacts crops and the overall supply to anticipate market price variations.


Monitor if Crops are Growing as Expected
- 190 weather stations & 5-year average variation curves
- Access NDVI, Soil Moisture, Temperature, and Soil Water Index
- Access historical weather data since 2014
Weather Impact
On Crops
Compare the last 8 years of satellite data from NOASS and COPERNICUS with today’s forecast to see how the weather impacts crops and the overall supply to anticipate market price variations.
Monitor if Crops are Growing as Expected
- 190 weather stations & 5-year average variation curves
- Access NDVI, Soil Moisture, Temperature, and Soil Water Index
- Access historical weather data since 2014

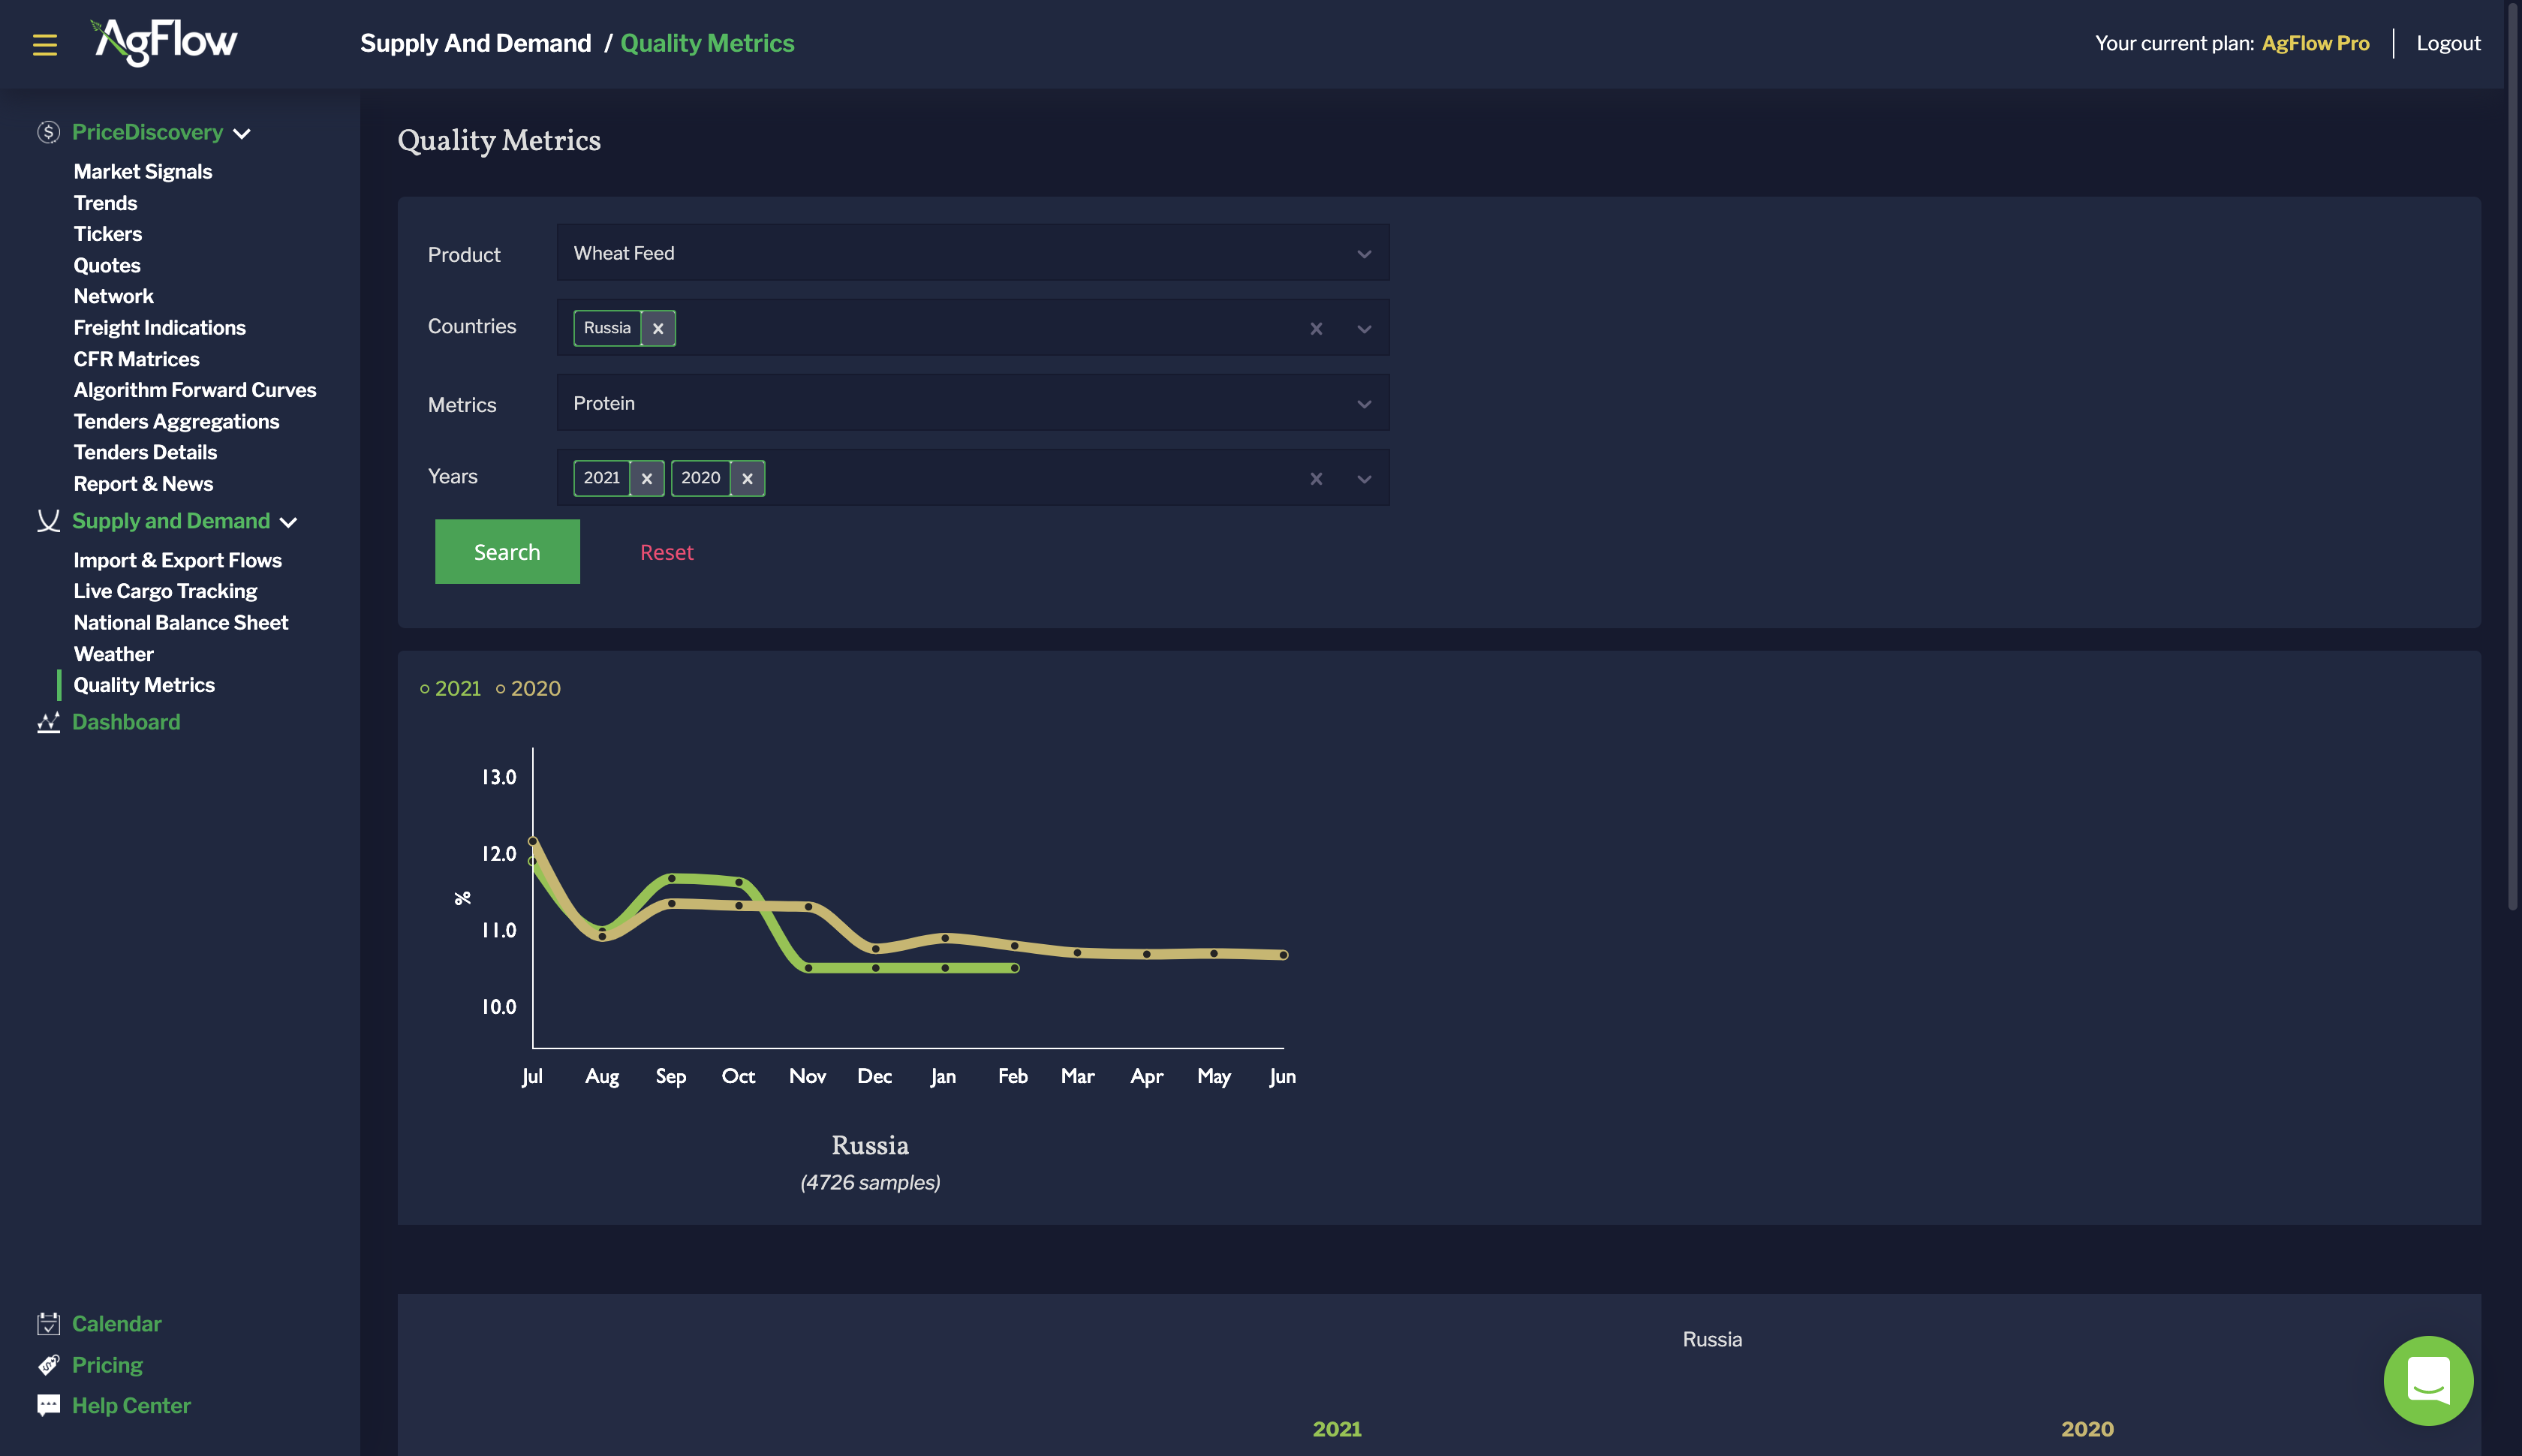
Wheat Crop Quality Monitoring
Access 100k+ Milling & Feed Wheat samples collected by SGS over the last 7 years, at export in 18 countries and across 9 specifications, and stay up to date thanks to an average of 3,000 new samples released monthly to:


Market Research
Modelize quality across origins and identify arbitrage opportunities.
Risk Management
Assess quality risks on open positions.
Sourcing
Ensure compliance with internal quality standards by verifying actual quality at export and change sourcing strategy if needed.
Trading
Track quality variations across origins to ensure cargoes will be on-spec.


Monitor Quality of Global Wheat Production
- Access +100k Milling and Feed Wheat samples collected by SGS
- Access historical crop data series since 2016
Wheat Crop
Quality Monitoring
Access 100k+ Milling & Feed Wheat samples collected by SGS over the last 7 years, at export in 18 countries and across 9 specifications, and stay up to date thanks to an average of 3,000 new samples released monthly.
Monitor Quality of Global Wheat Production
- Access +100k Milling and Feed Wheat samples collected by SGS
- Access historical crop data series since 2016

Why AgFlow?
Transparent
Data provided without revealing the source of information is not actionable and is therefore irrelevant.
This is why we provide you with the name and contact details of our contributors.
Evidence-Based
Synthetic data created out of a judgment is as good as the human behind it and is therefore inherently inaccurate.
This is why we report market events such as realized lineups.
Actionable
Data created out of context, disconnected from actual local realities is not timely and is inherently misleading.
This is why we provide you with transparent and fact-based information.


Join by 1,100+ of the agricultural market players

What Our Clients Have to Say
“There is simply no alternative out there, it’s either you collect all the data from different sources or you get AgFlow. This is the most complete spot and forward cash price data provider we could find.”
“I strongly recommend AgFlow to other traders or brokers dealing locally and willing to expand beyond their region, as such market data and information are not easy to get for smaller players.”

