Agricensus v. AgFlow
Looking for an alternative to Agricensus?
Fully Transparent Sources. Unbeatable Timeliness.
7x more Commodities.


Data on 11 Commodities
Data on 38 Countries
Monthly Price Assessments
– 125 Price Markers (Trends)
– No downloads
– 3 month Historicals
– Trends – Up to 9 months forward
– Refresh everyday
✓Data on 75+ Commodities
✓Data on 190+ Countries
✓Physical Cash Quotes
– 4k to 8k New Quotes (daily basis)
– Download all data as graphs or spreadsheets
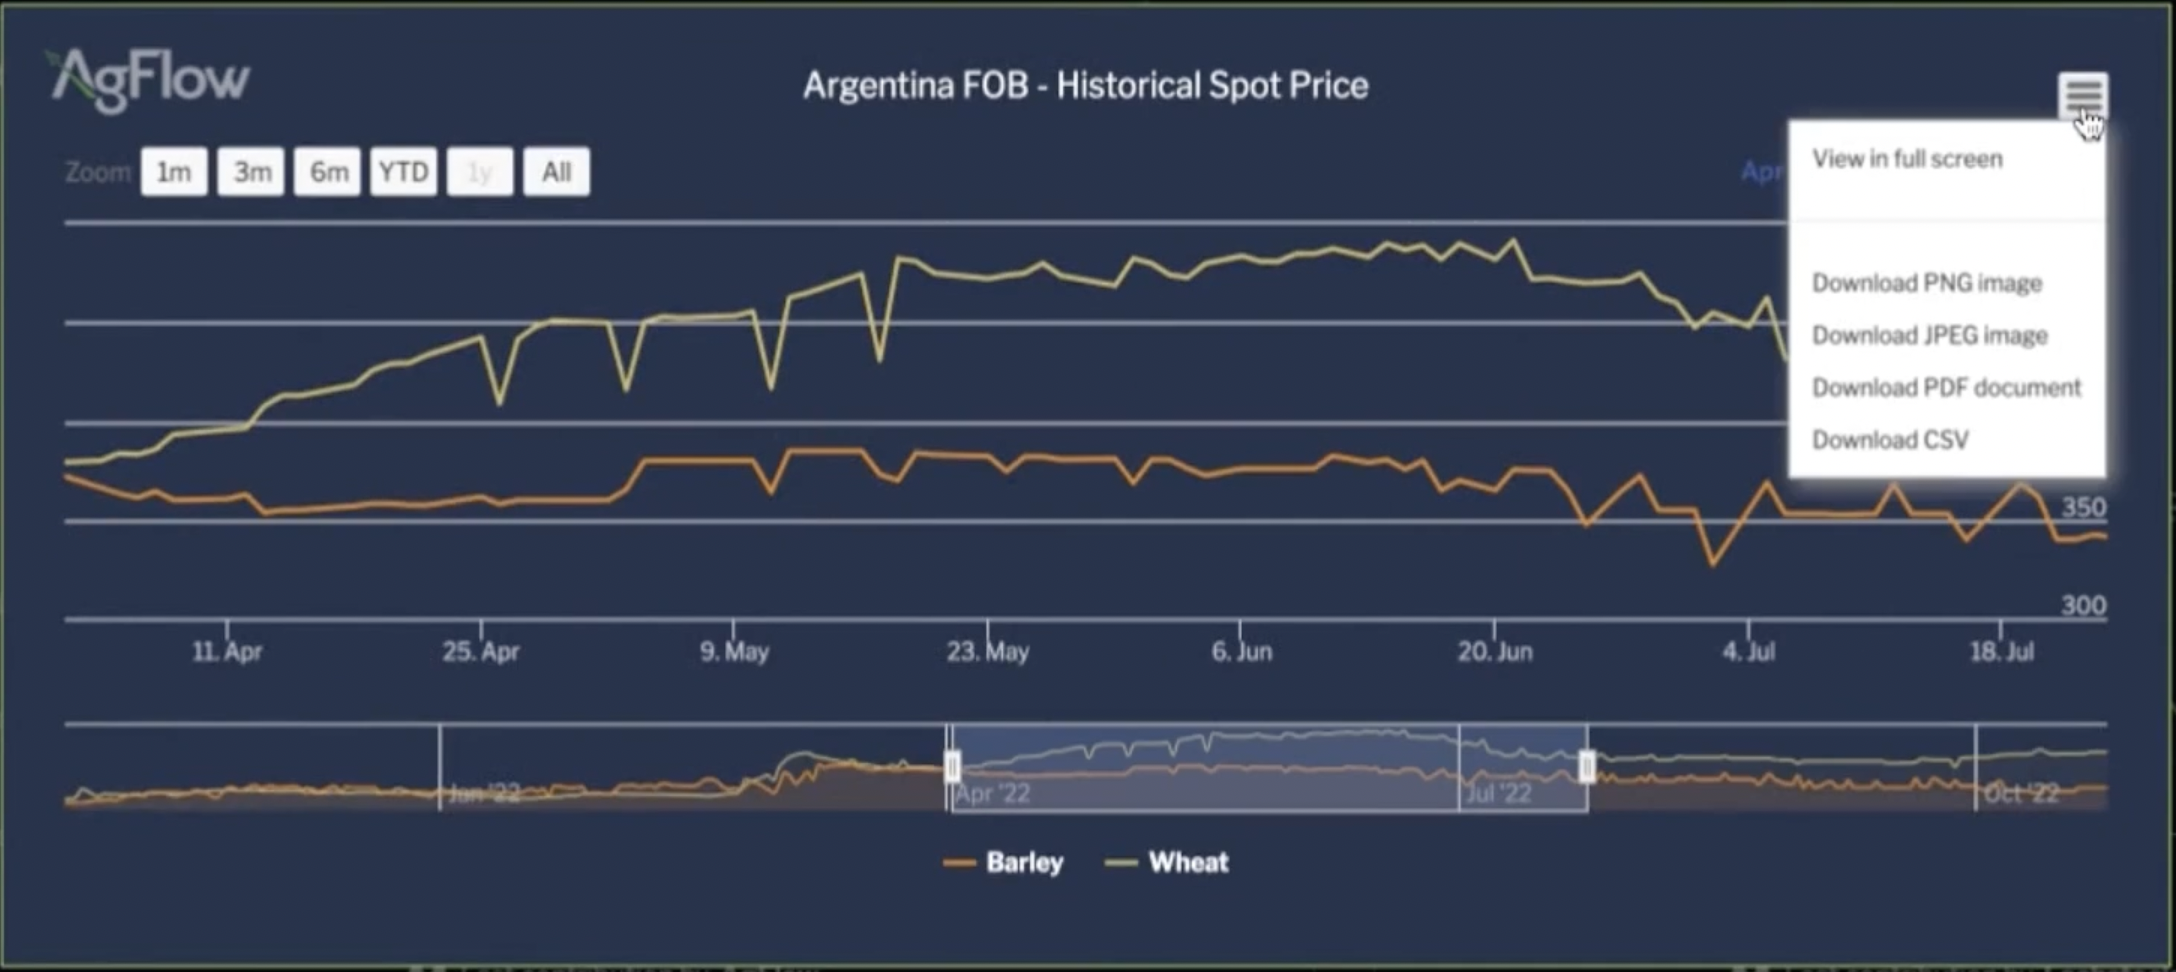
– 6-Month Historical Spot Prices
– Forward Curves
– Refresh up to several times a day
✓Data on 20 Commodities
✓Data on 10 Countries
✓Physical Cash Quotes Trends
– 1,234 Cash Quotes Trends
– No downloads
– 1-Year Historical aggregated Spot Prices
– Forward Curves
– Refresh everyday
Ag Demand
– Cargo data from Customs
– Up to 2 months delay
– Breakdown per year
✓Live Ag Demand
– Vessel and Cargo Data at origin & destination
– Two to seven months before customs cleared data
– Breakdown per month or quarter
– 2000+ vessels in 800 ports
– Vessel Lineup details (name & status, vol., imp. & exp. ports)
– Live Cargo Tracking with satellite AIS data
✓Live Ag Demand
– Vessel and Cargo Data at origin & destination
– Two to seven months customs cleared data
– Breakdown per month or quarter
– 2000+ vessels in 800 ports
Freights Assessments
– 26 routes
– 6-month historical spot curves
– No forward curves
– No vessel sizes & classes
– No loading and discharge rates
✓Freights Rates Indications
– 850+ routes
– 6-month spot rate historicals
– 12-month forward curves
– Vessel sizes & classes
– Loading & discharge rates
Starting at USD 845
✓Freights Rates Indications
– 550+ routes
– 6-month spot rate historicals
– No forward curves
– Vessel sizes & classes
– Loading & discharge rates
Starting at USD 199
They’ve Tried Both
“I compared prices on Agricensus and AgFlow. The prices published on AgFlow were much closer to reality.“

Download data (charts & spreadsheets)
Key Differences
 Prices
The Best Tool to Maximize Profit Margins
The Best Tool to Maximize Profit Margins
 Prices
The Best Tool to Maximize Profit Margins


Transparency
Price markers come from undisclosed sources.
✓ 4,000+ new physical cash quotes daily from our exclusive & fully transparent network of data contributors (incl. contact details).
Granularity
Cash quotes are supplemented with nine metadata.
✓Cash quotes are supplemented with eleven metadata – incl. price kind (buyer, seller, traded, nominal), delivery window, broker name, valid on date.
Timeliness
Price markers are published once per day.
✓Our global network of 100+ world-renowned and respected brokers sends us real-time updates on their daily transactions.
In an opaque market landscape, physical cash quote tracking is the best way for buyers and sellers to identify and seize origin arbitrage opportunities and shift from price-taker to a price-maker
 Ag Demand
The Only Tool to Leverage Markets Volatility
 Ag Demand
The Best Tool to Take Advantage of Markets Volatility


Timeliness
Customs cleared data is delayed two to seven months after loading at port level.
✓Import & export flows data is available at booking, two to seven months before customs-cleared data.
Accuracy
Yearly demand figures of 38 countries based on customs cleared data.
✓We track the geospatial position of 2,000 monthly vessels in real-time thanks to AIS data.
Completeness
Data available since 2012 on 38 countries.
✓We track 94% of the world’s Grains, Oilseeds, and Vegoils demand, representing 755+ Mmt by sea yearly in 800+ ports globally.
Commodities
✓Wheat, Corn, Soybean, Barley, Vegoils, Meal, Meat, Poultry, and Eggs.
100+ Grains, Oilseeds, Vegoils, Pulses & Softs (Cacao, Sugar)


